


How to Use AI as a Data Analyst: 40 Python, SQL & ChatGPT Prompts (2026 Guide)
data analyst | python for data analysis | data analysis tools | what is data analysis | ChatGPT prompts | gemini prompts
Why Most Data Analysts Still Waste 3 Hours a Day on Work AI Can Do in 3 Minutes
Here is a number that should bother you: the average data analyst spends 40% of their workday on tasks that have nothing to do with actual analysis. Cleaning data. Writing boilerplate SQL. Formatting reports. Translating findings into stakeholder language. Forty percent.
I am not going to claim AI eliminates all of that. But analysts who build a structured prompt library are cutting that number to under 15%. The difference is not the AI model they use. It is how they prompt it.
Vague prompts get vague answers. 'Analyze my data' gets you a paragraph of generic commentary and sometimes invented numbers. 'Act as a Senior Data Analyst, here is my schema, here is my business question, return Python code with inline comments' gets you something you can actually use. That gap is what this guide closes.
Quick Answer:
The best AI prompts for data analysis combine three things:
 (1) a specific expert role, e.g. 'Act as a Senior Analytics Engineer',
 (2) your actual schema or data context, and
 (3) a structured output format. Every prompt in this guide follows that pattern.
What Is Data Analysis? (And How AI Changes It in 2026)
Data analysis is the process of inspecting, cleaning, transforming, and modeling data to discover useful information, draw conclusions, and support decision-making. The five core stages are collection, cleaning, exploration, modeling, and communication. That has not changed in 30 years.
What has changed is execution speed. In 2024, writing a cohort retention query from scratch, debugging it, and formatting the output for a stakeholder took 2-3 hours. In 2026, with a well-structured AI prompt, that same task takes under 20 minutes. The skill requirement — knowing what the query needs to do, validating the output — is still human. The mechanical writing is increasingly AI-assisted.
AI has inserted itself into all five stages of data analysis:
- Collection: AI writes API scrapers and database extraction scripts in Python
- Cleaning: AI generates pandas pipelines that handle nulls, duplicates, and type mismatches
- Exploration: AI suggests hypotheses, writes EDA code, and flags anomalies
- Modeling: AI recommends statistical tests and generates scikit-learn or statsmodels code
- Communication: AI drafts executive summaries, Slack updates, and slide outlines
The analyst who learns to direct AI through all five stages is not replaced. They become a one-person analytics team.
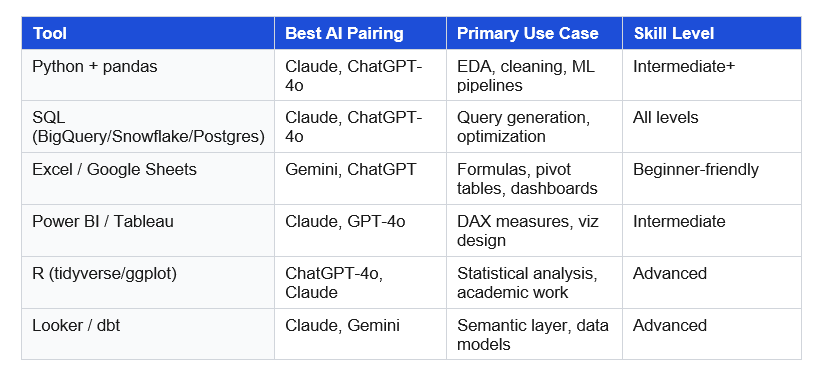
Data Analysis Tools in 2026: Which AI Works Best With Each
'Data analysis tools' generates over 8,100 searches per month because analysts are actively looking to upgrade their stack. This table maps the most common tools to the AI that works best with each one.
Section 1: Python for Data Analysis — 12 AI Prompts That Cut Hours to Minutes
'Python for data analysis' gets over 1,000 monthly searches. It is the core skill separating entry-level from mid-level analysts. These 12 prompts cover the full pandas workflow from profiling through reporting.
Prompt 1: Profile Any Dataset
Use this at the start of every project. Paste your schema, get a complete health check with code you can run immediately.
COPY THIS PROMPT
Act as a Senior Python Data Analyst.
My dataset has these columns and types:
[PASTE: column_name | dtype | example_value — one per line]
Write a Python function called profile_dataset(df) that:
1. Prints shape, dtypes, null counts, and null percentages per column
2. Flags any column with >5% nulls3. Shows value_counts (top 10) for all object/categorical columns
4. Prints mean, median, std, min, max for all numeric column
5. Detects likely duplicate rows based on [DESCRIBE YOUR KEY COLUMNS]
6. Returns a summary dict I can log to a pipeline
Pandas only. Docstring on the function. Type hints throughout.
Why it works: Providing column names + dtypes + examples forces real code, not pseudocode. The return dict makes it pipeline-ready immediately.
Prompt 2: Build a Reusable Data Cleaning Pipeline
COPY THIS PROMPT
Act as a Data Engineer building a reusable Python cleaning pipeline.
Known issues in my dataset:
- [ISSUE 1: e.g., dates in column C are mixed YYYY-MM-DD and DD/MM/YYYY
- [ISSUE 2: e.g., customer_id has leading zeros stripped in some rows]
- [ISSUE 3: e.g., revenue column has currency symbols and commas]
- [ISSUE 4: e.g., category column has 12 variations of 5 actual values]
Write a Python class called DataCleaner with:
- init accepting a pandas DataFrame
- A separate method per cleaning issue
- A .clean() method chaining all steps with logging of what changed
- A .report() method printing before/after row counts per step
Prioritize readability. Avoid regex unless necessary.
Prompt 3: Generate a Full EDA Script
Exploratory data analysis is where analysts spend 40% of project time. This prompt cuts it to under 15 minutes.
COPY THIS PROMPT
Act as a Python Data Scientist doing exploratory data analysis.
Dataset: [DESCRIBE: what each row represents, industry, time period covered]
Business question I'm answering: [PASTE YOUR EXACT QUESTION]
Target variable (if any): [COLUMN NAME or 'none']
Write a complete Python EDA script that:
1. Loads data from a CSV path
2. Profiles nulls, dtypes, and shape
3. Univariate analysis on each key column
4. Bivariate: correlation matrix + top 5 correlations with target
5. Creates 4 charts: distribution, correlation heatmap, time trend
   (if date column exists), top 10 values for key categorical column
6. Prints 3-5 key observations as comments in the script
Save charts to /charts folder. Comment each analysis step.
Prompt 4: Pandas Operations Cheat Sheet
When you need the right pandas line fast, not a full script.
COPY THIS PROMPT
Act as a pandas expert. Give me the most efficient pandas code for each:
1. Group by [COL A], calculate mean + median + count of [COL B]
2. Filter rows where [COL C] is in [LIST OF VALUES]
3. Create new column [NEW COL] = [DESCRIBE THE CALCULATION]
4. Pivot [COL D] into separate columns, fill nulls with 0
5. Merge df with df2 on [KEY COLS], keep only matched rows
6. Resample [DATE COL] to monthly frequency, sum [VALUE COL]
One-line comment per operation explaining the method choice.
Prompt 5: Python API Data Collection Script
COPY THIS PROMPT
Act as a Python Data Engineer.
API: [NAME]. Base URL: [URL]. Auth: [method].
Endpoint: [ENDPOINT + params]. Rate limit: [X req/min].
Expected total records: ~[NUMBER].
Write a Python script that:
1. Authenticates correctly
2. Paginates through ALL results (cursor/offset/page-based)
3. Handles rate limits with exponential backoff, max 3 retries
4. Logs progress every 100 records5. Saves raw JSON to data/raw/[source]_YYYYMMDD.json
6. Converts to flat DataFrame, saves CSV to data/processed/
Handle 429, 500, and network timeout errors.
Prompts 6-12: Quick Python Templates (Copy-Ready)
Prompt 6 — Feature Engineering for ML
Act as an ML Data Scientist. DataFrame columns: [LIST]. Target: [TARGET].
Create: lag-[N] for [TIME COL], rolling 7/30-day [METRIC],
interaction term [COL A] x [COL B], one-hot encode [CATEGORICAL COLS].
Flag any feature that risks data leakage for [classification/regression].
Prompt 7 — Merge and Validate a Join
 Act as a Data Analyst. df_left [describe] + df_right [describe].
Join on [KEY COLS] using [left/inner/outer] join.
Write 3 validation checks: row count vs expected, null check on keys,
sample of 5 rows where join may have duplicated records.
Prompt 8 — Time Series Resampling and Anomaly Detection
Act as a Python analyst. Date col [COL] at [granularity]. Resample to
[weekly/monthly] using [sum/mean/last]. Handle gaps: [fill method].
Calculate [N]-period rolling average. Mark periods outside 2 std dev as
anomalies. Plot results: matplotlib with anomalies highlighted in red.
Prompt 9 — Multi-Sheet Excel Report Export
 Act as a Python analyst using openpyxl. DataFrames: [LIST].
Create Excel with: (1) Summary sheet with KPIs in bold formatted cells,
(2) one sheet per DataFrame with frozen headers, (3) chart sheet with
bar chart of [METRIC by DIMENSION]. No raw DataFrame indices.
Prompt 10 — Debug a pandas Error
 Act as a Python debugging expert.
Code: [PASTE]. Error: [PASTE FULL TRACEBACK]. Schema: [df.dtypes output].
Root cause in one sentence. Corrected version. Explanation of fix.
Defensive coding pattern to prevent this class of error going forward.
Prompt 11 — OLS Regression and Interpretation
 Act as a Python Data Scientist. Dataset: [DESCRIBE]. Target: [TARGET].
Run: (1) Pearson correlation matrix for all numeric cols,
(2) OLS regression of [TARGET] on top 5 correlated features (statsmodels),
(3) Residual plot for heteroscedasticity check,
(4) Plain-English interpretation: R-squared, each coefficient, p-values.
Flag multicollinearity if VIF > 5.
Prompt 12 — Customer/User Clustering
 Act as an ML Data Scientist. Segment [customers/users] via clustering.
Features: [LIST WITH DTYPES].
Compare K-means vs hierarchical vs DBSCAN for this use case.
Python code: scale + encode, run model, elbow method for optimal k,
assign cluster labels. Describe each cluster in business terms.
Output DataFrame with original data plus a 'segment' column.
Don't just use ChatGPT. Learn to build custom LLM agents, RAG pipelines, and full-stack Agentic AI apps in our intensive 6-week program.
Section 2: SQL Data Analysis Prompts — 12 Templates for Any Warehouse
SQL is the core language of data analysis, and 'data analysis tools' searches prove analysts constantly need faster ways to write it. These 12 prompts are built for BigQuery, Snowflake, and Postgres.
Prompt 13: Generate Any Business SQL Query
COPY THIS PROMPT
 Act as a Senior Analytics Engineer working in [BigQuery/Snowflake/Postgres].
Tables and relationships:
- [TABLE 1]: one row per [grain]. Key: [PK]. Columns: [list]
- [TABLE 2]: one row per [grain]. Key: [FK -> TABLE 1]. Columns: [list]
Business question (verbatim): '[PASTE THE EXACT QUESTION]'
Write SQL using clearly named CTEs. Rules:
- No SELECT *
- Comment each CTE with its purpose
- List all business logic assumptions explicitly
- snake_case for all column aliases
- Final SELECT: no more than 8 columns
Prompt 14: Cohort Retention Analysis
COPY THIS PROMPT
 Act as a Product Analytics Engineer. Build cohort retention in [database].
Tables: users(user_id, signup_date, plan_type),
events(user_id, event_type, event_date).
Goal: weekly retention by signup cohort, last 12 weeks.
Retained = at least one [event_type] in week N post-signup.
Return: cohort_week, weeks_since_signup, cohort_size, retained_users,
retention_rate (decimal). Handle zero-event users as 0%, not NULL.
Comment the date spine logic.
Prompt 15: Optimize a Slow Query
COPY THIS PROMPT
 Act as a Data Engineer in [BigQuery/Snowflake/Postgres].
Query runtime: [X] seconds on ~[N] million rows.
[PASTE QUERY]
1. Identify top 3 bottlenecks with line references
2. Rewrite with optimizations annotated
3. Expected performance gain per change
4. Partitioning/clustering/indexing recommendation
5. Pre-aggregation strategy if runtime stays above [X]s
Prompt 16: Translate Stakeholder Questions to SQL
COPY THIS PROMPT
 Act as a Business Data Analyst.
Schema: [DESCRIBE TABLES AND WHAT EACH REPRESENTS]
Question from [role]: '[EXACT VERBATIM QUESTION]'
Step 1: Restate as a precise analytical question, resolve all ambiguity
Step 2: Write the SQL
Step 3: Explain the output in 3 plain-English sentences
Step 4: Flag 2 edge cases the stakeholder should know about
Prompts 17-24: Quick SQL Templates
Prompt 17 — Debug Failing SQL
 Act as a SQL debugging expert.
Query: [PASTE]. Error: [PASTE TRACEBACK].
Root cause in one sentence. Corrected query. Explanation.
Test query to verify fix on 100 rows.
Prompt 18 — Window Functions
 Act as a SQL expert in [database]. Write a window function query for:
[e.g. 7-day rolling revenue / customer LTV ranking / running order total].
Source: [TABLE + columns]. Explain the OVER clause parameters.
Prompt 19 — Deduplicate a Table
 Act as a Data Engineer. Table [NAME] has duplicates. Unique key: [COLS].
Write: (1) query showing duplicate count + examples,
(2) CTE with ROW_NUMBER() keeping latest by [timestamp],
(3) CREATE TABLE AS or INSERT OVERWRITE to apply safely.
Prompt 20 — Last-Touch Revenue Attribution
 Act as an Analytics Engineer.
Tables: sessions(session_id, user_id, session_date, utm_source,
utm_medium, utm_campaign), orders(order_id, user_id, order_date, revenue).
Assign each order to most recent session before purchase.
Fallback for orders with no prior session: label as 'direct'.
Output: revenue + order count by utm_source and utm_campaign.
Prompt 21 — Funnel Drop-Off Analysis
 Act as a Product Analyst.
Table: events(user_id, event_type, event_date).
Funnel steps in order: [LIST e.g. page_view > signup > first_purchase].
Show: users entering each step, users completing, drop-off rate,
and median time between consecutive steps.
Prompt 22 — Pivot Rows to Columns
 Act as an Analytics Engineer in [database].
Source query: [PASTE]. Pivot [COLUMN] values into columns: [LIST].
Fill NULLs with 0. Explain pivot approach since MySQL/BigQuery/
Postgres each handle this differently.
Prompt 23 — Refactor Legacy SQL
 Act as a Senior Analytics Engineer doing code review.
Legacy query: [PASTE].
Rewrite with CTEs, consistent naming, inline comments.
Flag logic bugs or missing early filters.
Do NOT change business logic — output must be identical.
Prompt 24 — Write dbt Schema Tests
 Act as an Analytics Engineer using dbt.
Model: [MODEL NAME]. Key columns: [LIST].
Write YAML tests: not_null on [COLS], unique on [KEY],
accepted_values for [CAT COL], and a custom generic test
flagging rows where [CONDITION e.g. revenue < 0].
Section 3: AI Prompts for Excel, Google Sheets & Gemini — 7 Templates
Not every analyst works in Python or SQL. Many do most of their work in Excel and Google Sheets, and tools like Gemini and ChatGPT have become genuinely good at writing formulas. 'Gemini prompts' and 'google gemini ai prompts' each carry over 1,000 monthly searches with Easy keyword difficulty — meaning this is a real ranking opportunity.
Prompt 25: Generate Cleaning Formulas for Excel and Sheets
COPY THIS PROMPT
 Act as a data analyst specializing in Excel and Google Sheets.
Dataset issues:
- [ISSUE 1: e.g., dates in column C are mixed MM/DD/YYYY and YYYY-MM-DD]
- [ISSUE 2: e.g., column B has leading/trailing whitespace]
- [ISSUE 3: e.g., column D has mixed case variations of the same value]
- [ISSUE 4: e.g., column A has duplicate IDs I need to flag]

For each issue: (1) Excel formula, (2) Google Sheets equivalent,
(3) plain-language explanation for a junior analyst,
(4) one edge case the formula does not handle.
Prompt 26: Build a Pivot Table Step by Step
COPY THIS PROMPT
 Act as a Business Analyst working in Excel.
Table columns: [LIST ALL]. Analysis goal: [DESCRIBE YOUR QUESTION].
Walk me through the pivot table:
1. What goes in Rows, Columns, Values, and Filters
2. Any calculated field needed and its formula
3. How to sort by the most important metric
4. 2-3 formatting tips to make it presentation-ready
5. The equivalent SQL query if I migrate to a database
Prompts 27-31: Quick Spreadsheet Templates
Prompt 27 — XLOOKUP vs INDEX-MATCH
 Act as an Excel expert. I need to look up [VALUE] from [TABLE] and return
[RETURN COL]. My data has ~[N] rows. Write both XLOOKUP and INDEX-MATCH.
Explain which is faster for my data size and XLOOKUP version compatibility.
Prompt 28 — Google Sheets + Gemini Dashboard
 Act as a Google Sheets specialist. Build a KPI dashboard showing [METRICS]
from a source tab called 'Data'. Write QUERY() functions per KPI.
Add conditional formatting: green if [CONDITION], red if [CONDITION].
Add sparklines for trend. Make it auto-refresh when 'Data' updates.
Prompt 29 — Power Query M Code
 Act as a Power Query expert. Source data issues: [DESCRIBE].
Write M code (or step-by-step UI) to: [LIST TRANSFORMATIONS].
Make the query refresh-safe when source data is replaced.
Prompt 30 — What-If Scenario Analysis in Excel
 Act as an FP&A Analyst. Model inputs: [LIST VARIABLES + CURRENT VALUES].
Output metric: [METRIC].
Set up Best/Base/Worst case scenarios. Walk me through:
(1) one-way Data Table for [VAR A], (2) two-way Data Table for
[VAR A] vs [VAR B], (3) Scenario Manager setup I can share.
Prompt 31 — Write DAX Measures for Power BI
 Act as a Power BI DAX expert. Measure needed: [DESCRIBE METRIC].
Context: visual filtered by [DIMENSIONS/SLICERS].
Handle: blanks, division by zero, [MTD/YTD] time intelligence.
Explain CALCULATE, FILTER, DATESINPERIOD usage. Step-by-step breakdown.
Section 4: Data Visualization Prompts — 5 Templates for Charts That Drive Decisions
Picking the wrong chart is the fastest way to kill a good analysis. These prompts help you choose, build, and narrate the right visuals.
Prompt 32: Choose the Right Chart Type
COPY THIS PROMPT
 Act as a Data Visualization Specialist.
Dataset: [DESCRIBE METRICS, DIMENSIONS, TIME RANGE]
Audience: [e.g., Product Managers / CMO / Board]
Question I'm answering: [PASTE YOUR ANALYTICAL QUESTION]
Recommend 3 chart types. For each:
- Name and why it fits this data and audience
- Exact axes, colors, and labels
- Most common mistake analysts make with this chart
- Best tool: Tableau / Power BI / Python / Excel
If I can only make ONE chart for a 2-minute presentation: which and why?
Prompt 33: KPI Dashboard Layout Design
COPY THIS PROMPT
 Act as a Business Analyst and Product Designer.
Dashboard in [Looker/Power BI/Tableau] for [TEAM].
Business goals: [LIST 3]. Metrics + refresh cadence: [LIST].
Design: (1) top-to-bottom layout with named sections,
(2) chart type per metric with rationale,
(3) recommended filters and slicers,
(4) 3 rules to prevent dashboard sprawl,
(5) alert thresholds for key metrics.
Prompts 34-36: Quick Visualization Templates
Prompt 34 — Python Matplotlib/Seaborn Chart
 Act as a Python visualization expert.
Create a [CHART TYPE] from DataFrame (columns: [LIST]).
Style: white background, labeled axes with units, descriptive title,
professional color palette for [business/scientific] context.
Data labels on bars if bar chart. Save 300dpi PNG to charts/[name].png.
Prompt 35 — Turn Charts into an Executive Narrative
 Act as a Data Storyteller and Executive Communications specialist.
Chart findings: [DESCRIBE EACH MAIN FINDING].
Write 3-paragraph narrative: (1) lead with the single most important
insight, (2) connect findings with causal logic, (3) propose 3 specific
actions for next quarter. Active voice. No jargon. Sentences under 20 words.
Prompt 36 — Executive Slide Outline
 Act as a Chief of Staff preparing a data presentation.
Key findings: [PASTE NUMBERS AND INSIGHTS].
Create 10-slide outline. Per slide: title, 2 key bullets, recommended
visual, and the one question it answers for the audience.
Slide 1 must open with the most important finding, not process.
Section 5: Statistical Analysis Prompts — A/B Tests, Forecasting & Hypothesis Testing
Prompt 37: Choose the Right Statistical Test
COPY THIS PROMPT
 Act as a Data Scientist with applied statistics expertise.
My question: [PASTE]
Data: sample size [N], groups [2/3+], outcome type [continuous/binary],
groups [independent/paired], normality assumption [yes/no/unknown].

1. Correct test and why
2. Assumptions and how to verify them
3. Python code using scipy or statsmodels
4. How to explain the result to a non-statistician in 2 sentences
Prompt 38: Design and Analyze an A/B Test
COPY THIS PROMPT
 Act as a Growth Data Scientist.
Testing: [WHAT]. Primary metric: [METRIC]. Baseline value: [VALUE].
MDE I care about: [%]. Daily traffic: ~[N] users, 50/50 split.

1. Required sample size and test duration
2. Statistical test and confidence threshold
3. Guardrail metrics to monitor
4. Top 3 pitfalls for this test type
5. Python or SQL to pull results and run analysis
Prompts 39-40: Forecasting and Scenario Analysis
Prompt 39 — Time Series Forecast
 Act as a Time Series Data Scientist. [N] months of [METRIC] data.
Forecast next [X] months. Compare ARIMA, Prophet, and XGBoost.
Justify based on: seasonality, trend strength, data length, interpretability.
End-to-end Python code. MAPE and MAE for each on a holdout set.
Prompt 40 — Sensitivity and Scenario Analysis
 Act as FP&A Analyst + Data Scientist. Forecast inputs: [LIST VARIABLES].
Output metric: [METRIC].
1. Rank top 3 variables by sensitivity
2. Best/Base/Worst case with specific variable values
3. Python: one-way sensitivity table and tornado chart
4. How to present this to a CFO in under 3 minutes
Section 6: Stakeholder Communication Prompts — Turn Numbers Into Action
The highest-leverage skill for any data analyst is not Python or SQL. It is making findings land. The analyst who can turn a complex analysis into a clear decision in 3 minutes is the one who gets promoted.
One-Page Executive Summary
COPY THIS PROMPT
 Act as a Business Data Analyst + Executive Communications Specialist.
My analysis notes and key findings:
[PASTE YOUR BULLETS, KEY NUMBERS, CHART FINDINGS]
Write a one-page executive summary:
- Open with the main takeaway in 2-3 sentences (insight first, not process)
- 4-5 key findings with specific numbers
- 3 concrete actions with owners and timelines
- One most important risk or limitation at the end
No jargon. Sentences under 20 words. Active voice. Every claim quantified.
Never use the word 'significant' without a number.
Audience-Specific Versions From the Same Analysis
COPY THIS PROMPT
 Act as a Business Data Analyst who adapts communication by audience.
Core findings: [PASTE]
Create 3 versions from the same data:
1. C-Level: Business impact and strategic decisions. 200 words max.
2. Product Managers: User behavior and backlog priorities.
   Include 2 suggested experiments with success metrics. 300 words.
3. Marketing Team: Campaign performance and tactical recs.
   Include 3 actions with estimated impact. 300 words.
Each version must feel written specifically for that person.
Slack and Email Update
COPY THIS PROMPT
 Act as a Data Analyst writing a leadership update.
Findings: [PASTE KEY NUMBERS + CONTEXT]
Write a Slack message (under 150 words):
- One-sentence headline with a number
- 3 bullet points with data
- One clear call to action
Then write the email version (under 300 words) with subject line.
Subject formula: [Metric] [Direction] [Time Period] - [Action Needed]
FAQ: People Also Ask About Data Analysis in 2026
These questions reflect the highest-traffic 'People Also Ask' clusters for 'data analyst' and 'data analysis' searches.
What does a data analyst do?
A data analyst collects, cleans, analyzes, and communicates data to help organizations make better decisions. Day-to-day work includes writing SQL queries, building dashboards in tools like Tableau or Power BI, running statistical analyses, and presenting findings to Product, Marketing, and Finance teams. In 2026, a significant share of data cleaning and code-writing is being done with AI assistance — shrinking a typical analysis from hours to minutes.
What is the best programming language for data analysis?
Python is the most-used language for data analysis, primarily through the pandas, NumPy, and scikit-learn libraries. SQL is equally important and arguably more common in day-to-day analyst work since most business data lives in warehouses like BigQuery, Snowflake, or Postgres. R is preferred in academic and statistical research contexts. Python gets over 1,000 monthly searches under 'python for data analysis' — it is the language worth learning first.
What is exploratory data analysis (EDA)?
Exploratory data analysis is the first analysis step after cleaning a dataset — before any hypothesis testing or modeling. EDA involves profiling the data (shape, null counts, dtypes), running univariate and bivariate statistics, visualizing distributions and correlations, and identifying patterns and outliers. A typical EDA in Python takes 1-3 hours manually. With Prompt 3 from this guide, the same process takes under 15 minutes.
How do I use ChatGPT or Gemini for data analysis?
The most effective method is role-based prompting: start every prompt with 'Act as a Senior Data Analyst' or 'Act as an Analytics Engineer,' then provide your schema, your business question, and your preferred tool (Python/SQL/Excel). Generic prompts produce generic output. Gemini works especially well for Google Sheets tasks via the Gemini side panel, while Claude and ChatGPT-4o produce more reliable results for complex multi-step SQL and Python workflows.
What data analysis tools do analysts use in 2026?
The most common tool stack includes: SQL (BigQuery, Snowflake, or Postgres) for extraction; Python with pandas, matplotlib, and scikit-learn for analysis; Tableau, Power BI, or Looker for dashboards; and Excel or Google Sheets for ad-hoc analysis. AI tools — ChatGPT, Claude, and Gemini — are increasingly integrated into each of these for code generation, formula writing, and communication drafting. The comparison table in Section 2 of this guide maps which AI pairs best with each tool.
Is data analysis a good career in 2026?
Yes — and the career profile is shifting. 'Data analyst' has over 135,000 monthly searches globally, reflecting both job seekers and learners. The demand for analysts who can work with AI tools is growing significantly faster than the demand for traditional analysts. Analysts who combine SQL + Python proficiency with strong stakeholder communication skills and AI tool fluency are among the most in-demand technical roles at mid-size and large companies in 2026.
What is the difference between data analysis and data science?
Data analysis focuses on understanding what happened and why — through descriptive statistics, cohort reports, trend analysis, and stakeholder communication. Data science extends into predictive work: building ML models to forecast outcomes, classify data, or surface complex patterns. In practice, most roles blur the line. A strong data analyst increasingly needs Python for ML workflows and statistical hypothesis testing, while data scientists need communication and stakeholder skills that are traditionally analyst strengths.
The Data Analyst Who Learns This in 2026 Wins the Next 5 Years
I have watched analysts with 10 years of experience get outworked by 2-year analysts who learned to use AI prompts systematically. Not because experience stopped mattering. Because experience plus AI is roughly 4x more productive than experience alone.
The shift is not complicated: stop treating AI as an occasional tool and start briefing it like a specialized copilot at the start of every task. Give it a role. Give it your schema. Tell it what format you need. The 40 prompts in this guide are those briefings — built for Python, SQL, Excel, visualization, statistics, and communication.
Start with the section that maps to your biggest current bottleneck. Save the prompts that work for your specific stack. Refine them. Build your personal prompt library from there.
Next Step: Explore the full Build Fast with AI Prompt Library — 500+ professional role prompts for Business Data Analyst, ML Data Scientist, Analytics Engineer, Data Engineer, and more. Each prompt drops into any AI tool and works immediately.
Explore: Business Data Analyst Prompts | ML Data Scientist Prompts | Analytics Engineer Prompts