


Will you let the market dictate your gains, or will you build your own AI Stock Market Agent?
Where you turn market data into smart decisions. Learn to create AI-driven trading strategies and take control of your financial future.
REGISTRATION LINK - Analyzing the Stock Market with AI
Introduction
In today's data-driven financial landscape, the ability to analyze stock market trends efficiently can mean the difference between profitable investments and missed opportunities. The convergence of artificial intelligence (AI) and powerful programming tools has revolutionized how investors approach stock market analysis.
Python has emerged as the leading programming language for financial analytics due to its simplicity, versatility, and robust libraries designed specifically for data analysis and machine learning. When combined with AI capabilities, Python becomes an even more powerful ally for both novice and experienced investors.
Google Colab, a free cloud-based platform that allows you to write and execute Python code through your browser, has recently integrated AI features that make stock market analysis more accessible than ever before. This eliminates the need for complex local setups or expensive software subscriptions, democratizing financial analysis tools for everyone.
In this comprehensive guide, we'll explore five practical use cases that demonstrate how you can leverage AI, Python, and Google Colab to gain valuable insights into stock performance, predict market trends, and optimize investment strategies—all without writing a single line of code yourself.
Use Case 1: Generating Python Code to Do Stock Market Analysis of Tesla
Analyzing the stock performance of Tesla can provide insights into its past performance and potential future trends.
Here's how you can retrieve and analyze Tesla's stock data with minimal effort:
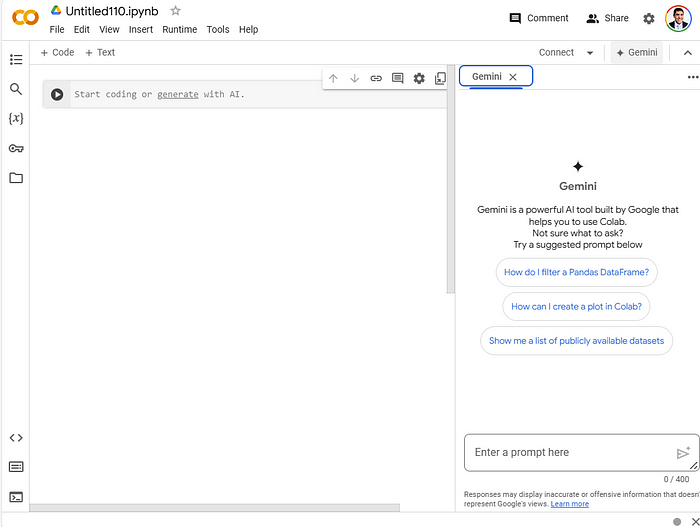
- Navigate to the top right corner of your Google Colab notebook and click on the Gemini icon
- In the Gemini sidebar, type: "Generate python code to do stock market analysis of Tesla"
- Review the AI-generated code, which will typically include data retrieval, basic statistical analysis, and visualization
 Finally, use the icon on the top right called "Add Code Cell" to insert the code into your notebook.
The code proposed by Gemini will appear in the left side and you just need to click the play button to "run the cell".
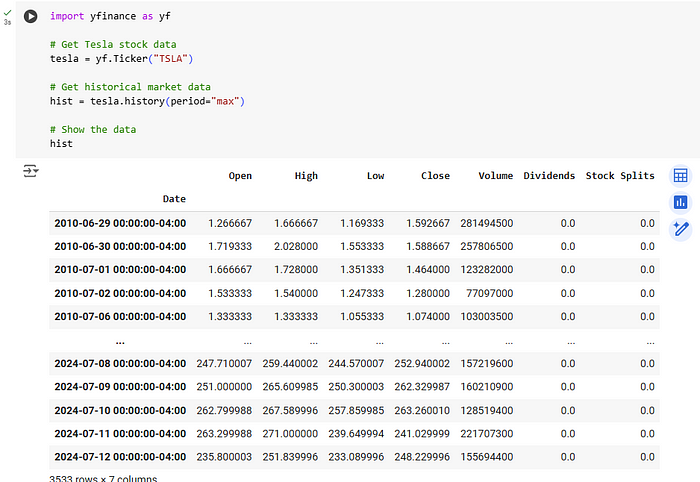
This simple process gives you immediate access to Tesla's historical stock data, visualized trends, and basic statistical insights without requiring you to know Python syntax or stock analysis methods.
Use Case 2: Calculating a Moving Average
A moving average is a fundamental technical analysis tool that smooths out price fluctuations by creating a constantly updated average price. This helps identify the direction of trends and potential support/resistance levels.
Follow these steps to calculate and visualize a moving average for any stock:
- Similar to the previous example, ask Gemini for moving average code by typing: "Generate code to calculate and plot a 50-day moving average for Tesla stock"
- Add the code to your notebook using the "Add Code Cell" button
- Run the cell to execute the code
 When you run the code, you'll see something like this:
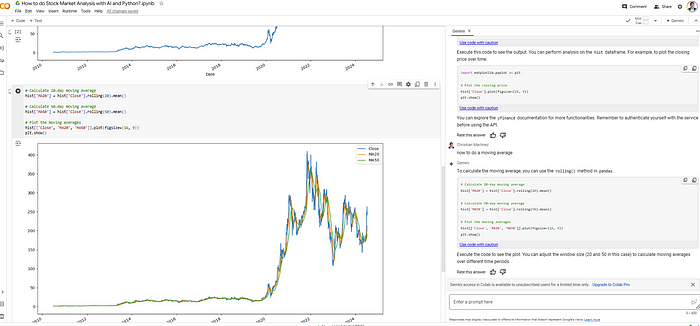
The visualization typically shows the actual stock price in one color and the smoothed moving average line in another color. This comparison helps identify potential buying or selling signals when the price crosses above or below the moving average line.
Use Case 3: Predicting Stock Prices with Machine Learning
Machine learning models can analyze historical stock data to identify patterns and make predictions about future price movements. While no prediction model is perfect, these tools can provide valuable insights to inform investment decisions.
Here's how to implement a simple machine learning model for stock price prediction:
- Ask Gemini: "Create a machine learning model to predict stock prices. Use data from yf library for the past prices and matplotlib for the visualization."
- Copy the generated code to your notebook and run it
Here's the complete code you can use:
!pip install yfinance matplotlib

import yfinance as yf
import pandas as pd
from sklearn.linear_model import LinearRegression
from sklearn.model_selection import train_test_split
import matplotlib.pyplot as plt

# Get stock data (replace 'AAPL' with your desired ticker)
ticker = "AAPL"
data = yf.download(ticker, start="2020-01-01", end="2023-01-01")
df = pd.DataFrame(data)

# Features and target variable
X = df[['Open', 'High', 'Low', 'Volume']]
y = df['Close']

# Split the data
X_train, X_test, y_train, y_test = train_test_split(X, y, test_size=0.2, random_state=42)

# Create and train the model
model = LinearRegression()
model.fit(X_train, y_train)

# Make predictions
predictions = model.predict(X_test)

# Evaluate the model (example: Mean Squared Error)
from sklearn.metrics import mean_squared_error
mse = mean_squared_error(y_test, predictions)
print("Mean Squared Error:", mse)

# Visualization
plt.figure(figsize=(12, 6))
plt.scatter(y_test, predictions)
plt.xlabel("Actual Closing Prices")
plt.ylabel("Predicted Closing Prices")
plt.title("Actual vs Predicted Closing Prices")
plt.show()
The output will look something like this:
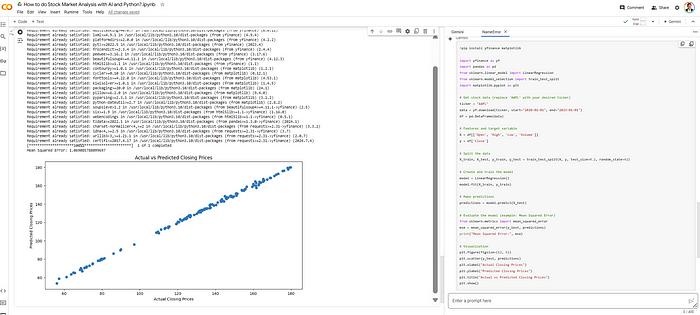
This visualization shows how closely the predicted prices match the actual prices. The Mean Squared Error (MSE) value gives you a quantitative measure of the model's accuracy—lower values indicate better predictions.
How It Works:
- The code uses Linear Regression, a simple but effective machine learning algorithm
- It trains on historical data including Open, High, Low, and Volume values to predict Closing prices
- The model is evaluated by comparing its predictions against actual prices that weren't used during training
- The scatter plot visually represents how well the predictions align with reality—points closer to the diagonal line indicate more accurate predictions
Don't just use ChatGPT. Learn to build custom LLM agents, RAG pipelines, and full-stack Agentic AI apps in our intensive 6-week program.
Use Case 4: Sentiment Analysis of Stock News
News and social media content can significantly impact stock prices. Sentiment analysis uses natural language processing (NLP) to determine whether news articles about a company are positive, negative, or neutral, providing insights into market sentiment that might affect stock performance.
You can implement sentiment analysis with this code:
from vaderSentiment.vaderSentiment import SentimentIntensityAnalyzer

# Initialize the sentiment analyzer
analyzer = SentimentIntensityAnalyzer()

# Analyze sentiment
sentiments = []
for article in news_data['articles']:
    text = article['title'] + " " + article['description']
    sentiment = analyzer.polarity_scores(text)
    sentiments.append(sentiment['compound'])

# Print sentiment scores
for i, article in enumerate(news_data['articles']):
    print(f"Article {i + 1}: {article['title']}")
    print(f"Sentiment Score: {sentiments[i]}")
Key Benefits of Sentiment Analysis:
- Identifies market sentiment beyond numerical data
- Provides early indicators of potential price movements
- Helps contextualize technical analysis with real-world events
- Can signal when news might cause short-term volatility
The sentiment scores range from -1 (extremely negative) to +1 (extremely positive), with 0 representing neutral sentiment. By tracking sentiment over time, you can spot trends in public perception that might precede stock price movements.
Use Case 5: Portfolio Optimization
Portfolio optimization uses mathematical techniques to find the optimal allocation of investments that maximizes returns while minimizing risk. This advanced technique helps investors make data-driven decisions about asset allocation.
Here's a sample code for portfolio optimization:
import cvxpy as cp
import numpy as np
import pandas as pd

# Dummy data: expected returns and covariance matrix
np.random.seed(42)  # For reproducibility

# Generate dummy expected returns for 4 assets
expected_returns = np.random.rand(4)
print("Expected Returns:", expected_returns)

# Generate a random positive semi-definite covariance matrix for 4 assets
random_matrix = np.random.rand(4, 4)
cov_matrix = np.dot(random_matrix, random_matrix.T)
print("Covariance Matrix:\n", cov_matrix)

# Number of assets
n = len(expected_returns)

# Define the variables: portfolio weights
weights = cp.Variable(n)

# Define the expected portfolio return
portfolio_return = expected_returns @ weights

# Define the portfolio risk (standard deviation)
portfolio_risk = cp.quad_form(weights, cov_matrix)

# Define the risk aversion parameter
risk_aversion = 0.1

# Define the objective: maximize return - risk_aversion * risk
objective = cp.Maximize(portfolio_return - risk_aversion * portfolio_risk)

# Define the constraints: weights sum to 1 and weights are non-negative
constraints = [cp.sum(weights) == 1, weights >= 0]

# Define and solve the problem
problem = cp.Problem(objective, constraints)
problem.solve()

# Optimal weights
optimal_weights = weights.value

# Display the results
print("Optimal Weights:", optimal_weights)

# Creating a DataFrame for better visualization
assets = ['Asset 1', 'Asset 2', 'Asset 3', 'Asset 4']
portfolio_df = pd.DataFrame({
    'Asset': assets,
    'Expected Return': expected_returns,
    'Optimal Weight': optimal_weights
})

print(portfolio_df)
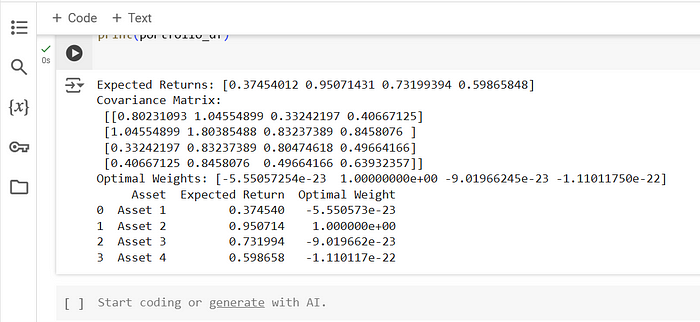
The output provides a table showing the optimal allocation of your investment across different assets:
How Portfolio Optimization Works:
- The code defines an objective function that balances return maximization and risk minimization
- It uses quadratic programming to solve for the optimal weights
- The risk aversion parameter allows you to adjust your preference between higher returns and lower risk
- The constraints ensure all weights are positive (no short selling) and sum to 100% of your investment
For real-world application, you would replace the dummy data with actual historical returns and calculated covariance of the assets in your portfolio.
Conclusion
The integration of AI capabilities into Google Colab has transformed stock market analysis, making sophisticated financial tools accessible to investors of all experience levels. By leveraging these AI-powered techniques, you can now perform complex analyses that previously required extensive programming knowledge or expensive financial software.
The five use cases we've explored—basic stock analysis, moving averages, machine learning predictions, sentiment analysis, and portfolio optimization—represent just the beginning of what's possible. As AI technology continues to advance, we can expect even more powerful and intuitive tools to emerge, further democratizing access to financial analytics.
Remember that while these tools provide valuable insights, they should complement rather than replace fundamental research and financial knowledge. The most successful investors combine technical analysis with a deep understanding of the companies they invest in and the broader market context.
Whether you're a casual investor looking to better understand market trends or a financial professional seeking to enhance your analytical toolkit, Google Colab's AI-powered environment offers a flexible, powerful platform for stock market analysis that grows with your needs and adapts to your investment strategy.
---------------------------
Stay Updated:- Follow Build Fast with AI pages for all the latest AI updates and resources.
Experts predict 2025 will be the defining year for Gen AI Implementation. Want to be ahead of the curve?
Join Build Fast with AI’s Gen AI Launch Pad 2025 - your accelerated path to mastering AI tools and building revolutionary applications.
---------------------------
The only comprehensive program designed to take you from basic prompting to building interactive Artifacts, custom integrations, and deploying production-ready code with Claude Code.
Resources and Community
Join our community of 12,000+ AI enthusiasts and learn to build powerful AI applications! Whether you're a beginner or an experienced developer, our resources will help you understand and implement Generative AI in your projects.
- Website: www.buildfastwithai.com
- LinkedIn: linkedin.com/company/build-fast-with-ai/
- Instagram: instagram.com/buildfastwithai/
- Twitter: x.com/satvikps
- Telegram: t.me/BuildFastWithAI